Business
Facebook - A Case Study - Part 2

Facebook - Part 2: Facebook Financials Analysis
This is the second of my three-part Facebook research series. It provides some background numbers on how the company is doing financially based on figures on their public website at the 3rd quarter of 2016. These information would eventually build up to my market strategy analysis at part 3.
Overview
Facebook is currently the largest social networking platform in the world that has been experiencing significant growth and value. In the latest Fortune 500 report, Facebook has been listed for 4 years, and has increased its ranking from 242 to its current ranking at 157. It is also ranked number 3 in the 100 fastest growing companies
Background
Facebook was founded in February 2004, and it went public on May 2012

On February 2012 when Facebook filed its S-1 Form, the
company was primarily in the display-advertising business with a net profit of
$1 billion in 2011 from a total revenue of $3.7 billion (Safdar, 2013) . It is interesting
to note that when Facebook went for IPO, its prices were at record value of $38
a share, which equates to around $104 billion market valuation (Wall Street
Journal, 2012) .
This, however, did not last long as it was noted that with more users moving
from desktop to mobile platforms, the initial projected revenue was
misrepresented. This led to a revised S-1 where Facebook released to the public
that mobile ads presented an ongoing challenge for the firm. That impacted
investor’s confidence, and prices plummeted ever since. It took almost a year
later in July 2013 for the prices to return to the initial price after Facebook
released more features like Facebook Exchange in bids to have more targeted
advertising to fulfill advertising demand (An, 2014) . Much have
progressed since. Facebook picked up on this area and have new solutions like
Dynamic Ads and Custom Audiences that have mobile at their core and are
delivering excellent results for the businesses. Developers can also access
Facebook APIs to innovate and build great advertisement experiences for their
brands and customers. These new solutions work so well in revenue generating
that Facebook prices have been increasing ever since, and Facebook recently
announce to decommission its old advertising solution, Facebook exchange, in November
2016 this year make way for new advertising solutions (Marvin, 2016) .

Financial
Situation – Rapid Growth
To understand Facebook’s current financial situation,
I started by looking at the latest financial reports in Facebook’s official investor’s
website (Facebook, 2016) . My overall analysis
is that Facebook is currently at a good financial situation and the information
below will elaborate this finding further.
From the Assets category in the Balance Sheet, we can
tell that Facebook’s total asset value has been constantly increasing over
time, reaching its current peak at $55.74 billion. Also, with some calculation,
the rate of increase is generally increasing over time too (i.e. from 5.17% in
early 2015 to 7.04% in 2016). It is also interesting to note that most of the
increase is due to marketable securities from current assets. Goodwill also
takes up a significant portion of Facebook’s assets. Other assets like property
and equipment takes up a much smaller amount in comparison. These means
Facebook’s key assets are less physical in nature, and are increasingly on investments
in marketable securities that can be easily converted back to cash later if the
need arises.

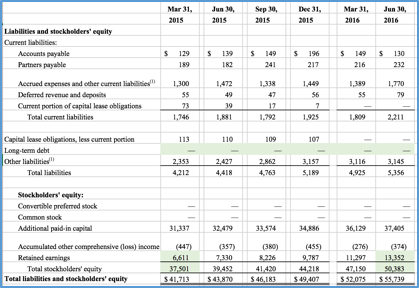
Next, looking at Facebook’s Total Liability and Total Stakeholder’s Equity, we can tell that the company has cleared all of its long term debts for a period of time, and is highly profitable considering the continuous increase in retained earnings from around $6 .6billion in 2015 to more than two times the original amount at $13.35 billion at the last quarter. This increases the total stockholder’s equity from $37.5 billion in 2015 to the current $50.4 billion today. This is a good sign because instead of having debt in the liabilities section to pay others, money is in its stockholder’s pocket, ready to continue to invest back into the company for future growth.
Next, moving on to the income statements, Facebook’s
current revenue is at $6.44 billion. Comparing the rate of increase in revenue
($6,436-$3,543 =$2,893) with total costs and expenses ($3,690-$2,610=$1,080), the company is generally making money faster than it is spending. The chart below further elaborates Facebook’s
revenue growth in comparison with the Year-Over-Year growth. We can see that
the trend is positive.


This is useful information because though most of Facebook’s revenue is from two categories, “Advertising” and “Payments and Other Fees”, and we can see from the chart that “Advertising” takes up a significant larger portion of the pie (i.e. 96.94% in Q2’16 ). Considering the attractiveness of a platform for advertisers is its effective outreach, the increase in active users would have a positive corelation with the amount of revenue from advertising.

Finally, it is also
interesting to consider the spending power of the users that are on Facebook’s
platform. For example, though the number of monthly active users in US &
Canada is smaller (226 million) in comparison to the rest of the world (556
million), the revenue is $3,212 million in comparison to $614 million. In other
words, every user in USA & Canada is generating $13.74/user, but the number
is significantly smaller at $1.12/user in the Rest of the World.

Financial Stability

Though most Software-as-a-service companies can be
analyzed with the Cost of Customer Acquisition (CAC) in comparison to the
monetization in Life Time Value (LTV) (Skok, 2014) ,
the formula for the Magic number does not fully apply for Facebook. This is
probably because Facebook does not follow a subscription model, and does not seem
to use Sales and Marketing expenditure as a key avenue to acquire customers.
Furthermore, the lifetime of its customers can last for years, as long as the
platform remains attractive to them.
Also, Facebook has a more interesting way to acquire customers. They do it through acquisitions and this move allows the company to not only purchase users, it also allows Facebook to acquire talents as employees in their firm. Some of the more famous acquisitions include purchasing Instagram for $1 billion in 2012
Among these acquisitions, the most interesting one is with Whatsapp. At the time of acquisition, WhatsApp is an ad-free mobile application that is free to use, with subscription kicking in after the first year. The messaging service which reached 400 million active users in December, generated less than 3 cents in revenue per user. Though that sums up to around $10.2million in total revenue, its net loss was $138.1 million in 2013. Despite these losses, Facebook’s $21.8 billion acquisition equates to paying for $55 per user
When comparing Facebook to its competitors, we can
look at the net profit margins (Analysis, 2016) . From the table below, we can see that Facebook
is generally doing well other than the year it IPO in 2012.

To analyze Facebook’s financial stability, investors would be interested in the ROIC (Return of Invested Capital), ROA (Return of Assets) and Return of Equity (ROE). The tables below generally show an upward trend.
This upward trend is also further supported by the Earnings per Share (EPS) figures from NASDAQ

Claims of effective advertising on Facebook and
Instagram is backed up by examples. For example, Lighting Etc., a
third-generation family-owned business, used Facebook and Instagram ads to
drive in-store sales. They targeted 25-45-year-old homeowners interested in
interior design, living within 35 miles of their showroom in Fort Worth, Texas.
It was striking to them that being on Facebook meant they could reach over
300,000 people even with such specific targeting. They have seen a 40% increase
in revenue in 2016.
Though these advertisement methods prove to be
working, the only word of caution is that Facebook pages is currently already
filled with “Ad Load”. In other words, it has currently crammed the newsfeed of
its users to a point that it thinks it can fit without turning users off (D'Onfro, 2016) . Facebook needs to
figure how to increase revenue from advertisements without increasing the
quantity of advertisements appearing for its users. Also, more may need to be
done to figure how to monetize people in other regions of the world that has
less spending power. Other than this, the company’s general outlook looks great
for investors considering it is still continuously growing its user base and
engaging them to be active users, and balancing the expenses out by increasing
its revenue through effective advertising.
Conclusion
Therefore, in summary, for Facebook’s current
financial situation, its large volume of user generated data and advertisers
are the biggest contributors to its financial health. With over 1.7 billion
users, Facebook is able to continuously distribute advertisements on its two
main platforms on Desktop and Mobile, making an average of $3.82 per user
worldwide. The future outlook looks good as well for Facebook as it
continuously seeks ways to increase its user base and address it with effective
targeted advertising. To continue to stay attractive for investors, Facebook
will need to continuously seek ways to retain the number of active users, increase
the value per user not only in developed countries, but also in developing
countries, while balancing the amount of advertisements shown, ensuring that it
does not turn their users off.
References
Crunchbase. (2016, October). Crunchbase. Retrieved from Crunchbase: https://www.crunchbase.com/organization/facebook
Statista. (2016, October). Statista. Retrieved from Statista: https://www.statista.com/statistics/264810/number-of-monthly-active-facebook-users-worldwide/
Wall Street Journal, S. R. (2012, May 17). Facebook Prices IPO at Record Value. The Wall Street Journal.
Safdar, K. (2013, May 20). The Atlantic. Retrieved from The atlantic: http://www.theatlantic.com/business/archive/2013/05/facebook-one-year-later-what-really-happened-in-the-biggest-ipo-flop-ever/275987/
An, Z. Y. (2014, July 29). Lei Phone Net. Retrieved from Lei Phone Net: http://www.leiphone.com/news/201406/facebook-nixi-wall-street.html
Marvin, G. (2016, May 25). Marketing Land. Retrieved from Marketing Land: http://marketingland.com/facebook-sunset-fbx-desktop-retargeting-favor-mobile-capabilities-178703
Facebook. (2016, October). Facebook. Retrieved from Facebook: https://investor.fb.com/financials/?section=quarterlyearnings
Fortune500. (2016, October). Fortune 500. Retrieved from Fortune 500: http://beta.fortune.com/fortune500/facebook-157
Skok, D. (2014). For Entrepreneurs. Retrieved from For Entrepreneurs From David Skok: http://www.forentrepreneurs.com/customer-acquisition-monetization/
Deutsch, A. L. (2015, March 25). Investopedia. Retrieved from Investopedia: http://www.investopedia.com/articles/investing/032515/whatsapp-best-facebook-purchase-ever.asp
Dredge, S. (2014, July 22). The Guardian. Retrieved from The Guardian: https://www.theguardian.com/technology/2014/jul/22/facebook-oculus-rift-acquisition-virtual-reality
Frier, S. (2014, October 28). Bloomberg Technology. Retrieved from Bloomberg Technology: https://www.bloomberg.com/news/articles/2014-10-28/facebook-s-22-billion-whatsapp-deal-buys-10-million-in-sales
Gelles, D. (2014, February 20). Deal Book. Retrieved from Deal Book: http://dealbook.nytimes.com/2014/02/20/for-facebook-its-users-first-and-profits-later/?_r=1
D'Onfro, J. (2016, July 27). Business Insider. Retrieved from Business Insider: http://www.businessinsider.com/facebook-ad-loads-less-important-for-growth-2016-7
Analysis, S. (2016, October). Stock Analysis on Net. Retrieved from Stock Analysis on Net: https://www.stock-analysis-on.net/NASDAQ/Company/Facebook-Inc/Long-Term-Trends/Net-Profit-Margin#Comparison-to-Competitors
Focus, G. (2016, October). Guru Focus. Retrieved from Guru Focus: http://www.gurufocus.com/term/ROC/FB/Return-on-Capital/Facebook-Inc
Nasdaq. (2016, October). Nasdaq. Retrieved from Nasdaq: http://www.nasdaq.com/symbol/fb/eps-forecast
Main image: http://www.makeeasymoney365.com/wp-content/uploads/2012/04/Facebook-IPO.jpg


No comments